Real Account Trading Performance Analysis on cTrader
Real Account Trading Performance Analysis on cTrader
In this post, I will share the results of my recent trading performance on a real cTrader account. The analysis is based on a 2-3 day trading period, and I will break down the performance of a $300 account, as well as extrapolate the results for $100 and $200 accounts. This is a real-world test, and the results provide valuable insights into how small accounts can perform in live trading conditions.
Key Metrics:
- Initial Deposit: $300
- Final Balance: $315.37
- Profit: $15.37
- Profit Percentage: 5.12% (($15.37 / $300) * 100)
- Maximum Drawdown (Max DD): $10 (observed during the trading period)
Performance Breakdown:
$300 Account:
- Initial Deposit: $300
- Final Balance: $315.37
- Profit: $15.37
- Profit Percentage: 5.12%
- Max DD: $10 (3.33%)
$200 Account (Extrapolated):
- Initial Deposit: $200
- Final Balance: $215.37
- Profit: $15.37
- Profit Percentage: 7.5%
- Max DD: $10.0 (6.66%)
$100 Account (Extrapolated):
- Initial Deposit: $100
- Final Balance: $115.37
- Profit: $15.37
- Profit Percentage: 15%
- Max DD: $10.0 (10%)
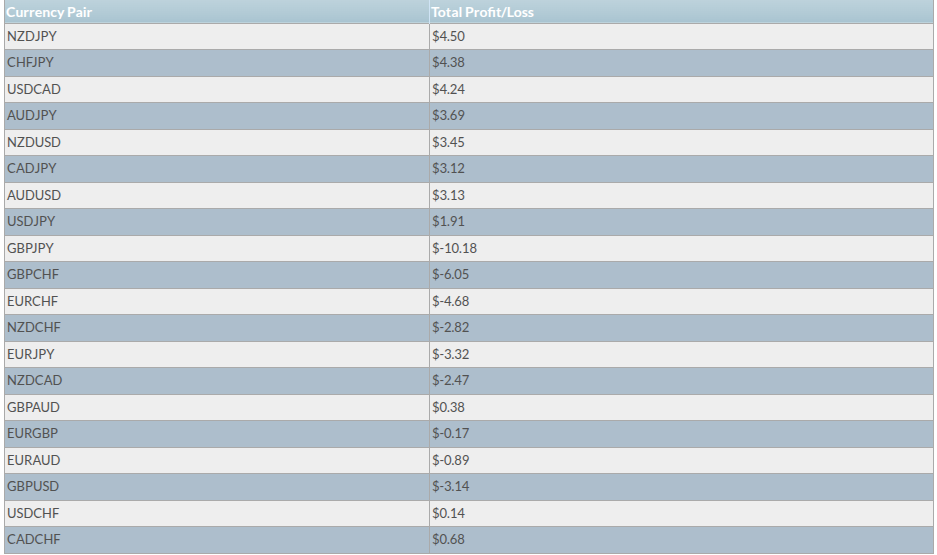
Currency Pair Performance:
I traded multiple currency pairs during this period, and here’s how each pair performed:
| Currency Pair | Total Profit/Loss |
|---|---|
| NZDJPY | $4.50 |
| CHFJPY | $4.38 |
| USDCAD | $4.24 |
| AUDJPY | $3.69 |
| NZDUSD | $3.45 |
| CADJPY | $3.12 |
| AUDUSD | $3.13 |
| USDJPY | $1.91 |
| GBPJPY | $-10.18 |
| GBPCHF | $-6.05 |
| EURCHF | $-4.68 |
| NZDCHF | $-2.82 |
| EURJPY | $-3.32 |
| NZDCAD | $-2.47 |
| GBPAUD | $0.38 |
| EURGBP | $-0.17 |
| EURAUD | $-0.89 |
| GBPUSD | $-3.14 |
| USDCHF | $0.14 |
| CADCHF | $0.68 |
Sorted Currency Pairs by Profitability:
Here’s how the pairs performed, sorted from most profitable to least profitable:
- NZDJPY: $4.50
- CHFJPY: $4.38
- USDCAD: $4.24
- AUDJPY: $3.69
- NZDUSD: $3.45
- CADJPY: $3.12
- AUDUSD: $3.13
- USDJPY: $1.91
- CADCHF: $0.68
- USDCHF: $0.14
- GBPAUD: $0.38
- EURGBP: $-0.17
- EURAUD: $-0.89
- NZDCHF: $-2.82
- NZDCAD: $-2.47
- EURJPY: $-3.32
- GBPUSD: $-3.14
- EURCHF: $-4.68
- GBPCHF: $-6.05
- GBPJPY: $-10.18
Most and Least Profitable Pairs:
- Most Profitable Pairs:
- NZDJPY: $4.50
- CHFJPY: $4.38
- USDCAD: $4.24
- Least Profitable Pairs:
- GBPJPY: $-10.18
- GBPCHF: $-6.05
- EURCHF: $-4.68
Observations from Real Account Testing:
-
Small Accounts Can Perform Well: Even with a $300 account, a 5.12% return in 2-3 days is achievable. Smaller accounts ($100 and $200) showed even higher percentage returns (15% and 7.5%, respectively), though the absolute profit remains the same.
-
Risk Management is Key: The maximum drawdown was $10, which is 3.33% of the $300 account. This is a manageable risk level, but it’s important to keep drawdowns under control, especially for smaller accounts.
-
Pair Selection Matters: Some pairs, like NZDJPY and CHFJPY, were highly profitable, while others, like GBPJPY and GBPCHF, resulted in significant losses. Careful pair selection and analysis are crucial for consistent performance.
-
Consistency is Important: While the overall result was positive, there were both winning and losing trades. This highlights the importance of sticking to a strategy and not being discouraged by individual losses.
Conclusion:
Testing on a real cTrader account provided valuable insights into how small accounts can perform in live trading conditions. Over a 2-3 day period, the $300 account generated a 5.12% return, while smaller accounts ($100 and $200) showed even higher percentage returns. The most profitable pair was NZDJPY, while GBPJPY was the least profitable.
This real-world test demonstrates that with proper risk management and strategy, even small accounts can achieve meaningful returns. However, it’s important to remain disciplined and avoid overtrading, especially when dealing with smaller account sizes.